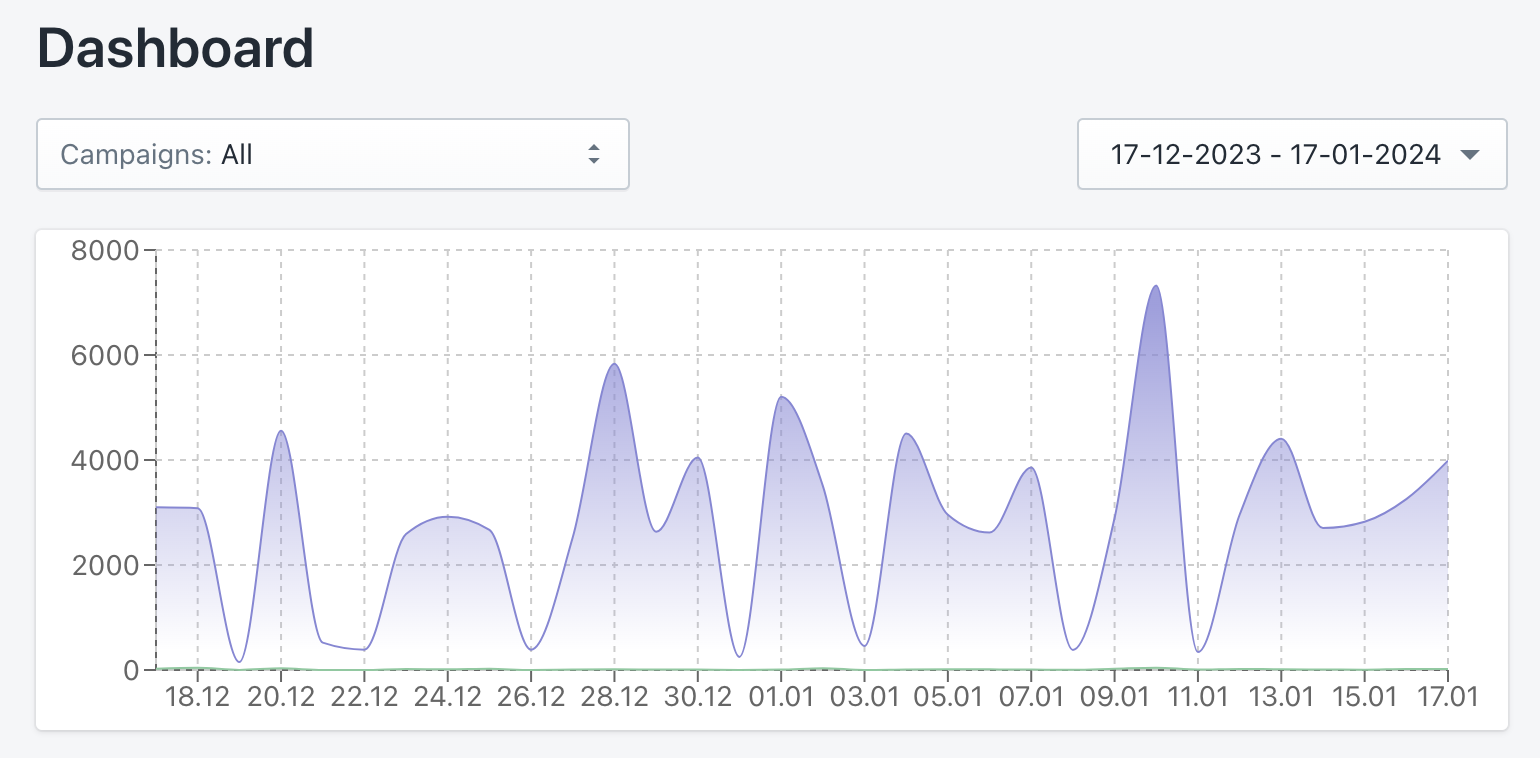
The Dashboard serves as your centralized hub for gaining a comprehensive overview of your campaign statistics, providing a bird’s-eye perspective on performance metrics. It’s where you check out key stats like how many times people saw your ads (impressions), how many clicked on them, and the Click-Through Rates (CTRs).
Whether you prefer a summary of all your campaigns or an in-depth analysis of each campaign individually, the Dashboard accommodates both. Use the select in the top left to pick specific campaigns, and on the right, choose the time range you’re interested in. The default time range displayed is 30 days.
As you scroll down, a visually insightful chart depicts the fluctuations in impressions and clicks. Further down, concise tiles summarize crucial numbers for the chosen period, offering a snapshot of campaign performance. The subsequent table provides a detailed breakdown of impressions, clicks, and CTRs for each day.
Follow these tips to optimize your Dashboard experience:
- Campaign Precision: Utilize the selection tool to focus on individual campaigns, facilitating a detailed analysis.
- Temporal Analysis: Experiment with the date range selector to uncover trends and patterns over specific time frames.
- Chart Insights: Explore the chart for a visual representation of your campaigns’ performance dynamics.
- Tile Insights: The tiles below the chart serve as a quick-reference guide, distilling complex data into easily digestible insights.
- Daily Examination: Delve into the daily breakdown table to scrutinize the performance of your campaigns on a granular level.
The Dashboard is your analytical command center – delve into the metrics, derive insights, and make informed decisions to elevate your campaign strategies.