Click Analytics is your compass for understanding the clicks your ads generate and the subsequent traffic directed to your website.
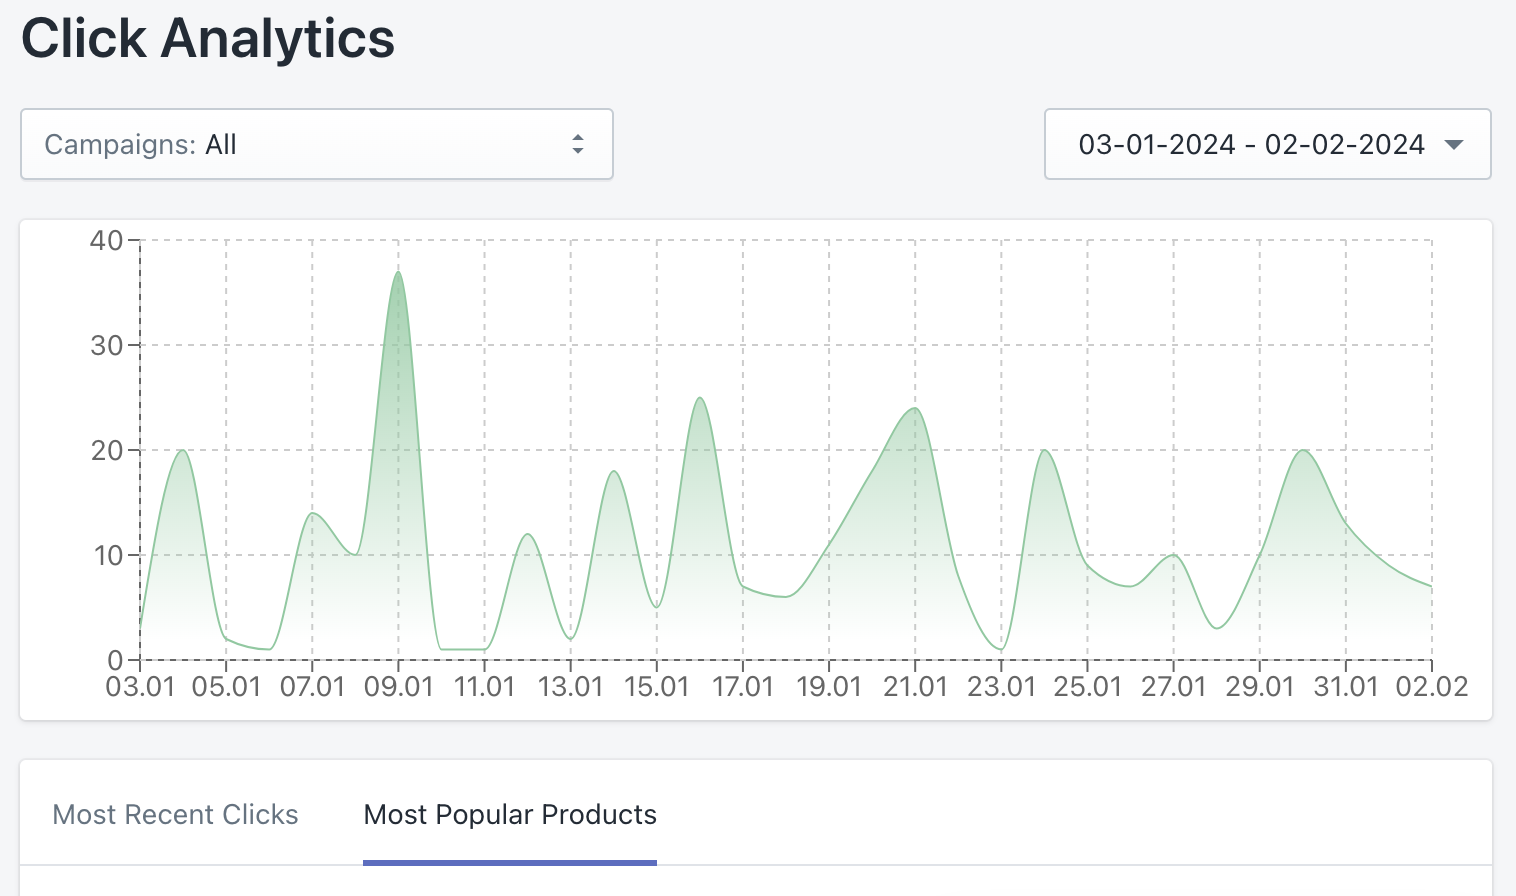
To get started, simply navigate to the top left corner, where you can choose to analyze clicks across all campaigns or zero in on a specific one. On the top right, select your desired time period for the report.
Directly below, a chart awaits, breaking down the daily clicks throughout your chosen period.
Upon entering this section, two tabs catch your eye: ‘Most Recent Clicks’ and ‘Most Popular Products’.
In the ‘Most Recent Clicks’ tab, delve into a chronological analysis of clicks. Explore the peak click times, along with details like campaign names, titles and images of the clicked products. This provides an exact snapshot of how users interact with your banners, presenting each click in chronological order.
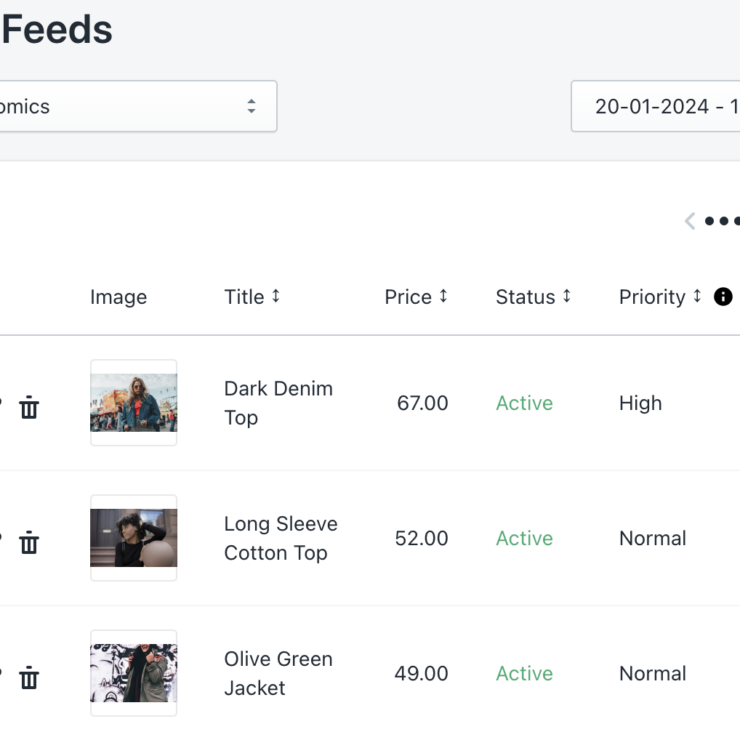
Switching to the ‘Most Popular Products’ tab offers an aggregated view. Alongside product titles and images, discover the total clicks each product received. Use this insight to identify your most popular products, helping you decide whether to boost their exposure in the Product Feeds section. You can boost particular products by editing them and setting their priority in the Product Feeds section. Setting priority to ‘Highest’ will give the product more exposure, which should translate to more clicks as well.
Here are some pointers to make the most of your Click Analytics experience:
- Campaign Precision: Use the selection tool in the top left to focus on individual campaigns for detailed analysis.
- Temporal Insight: Experiment with the date range selector on the right to unveil trends over specific time frames.
- Chart Exploration: Dive into the chart for a visual representation of your ads’ performance dynamics.
- ‘Most Recent Clicks’ Tab: Dive into the chronological order of clicks, revealing peak times and insights on user interactions.
- ‘Most Popular Products’ Tab: Explore an aggregated view highlighting the most-clicked products, aiding strategic decisions for boosting exposure.
Click Analytics is another section in the app for unraveling the performance of your ads – explore the insights, glean valuable information, and make informed decisions to elevate your campaign strategies.


