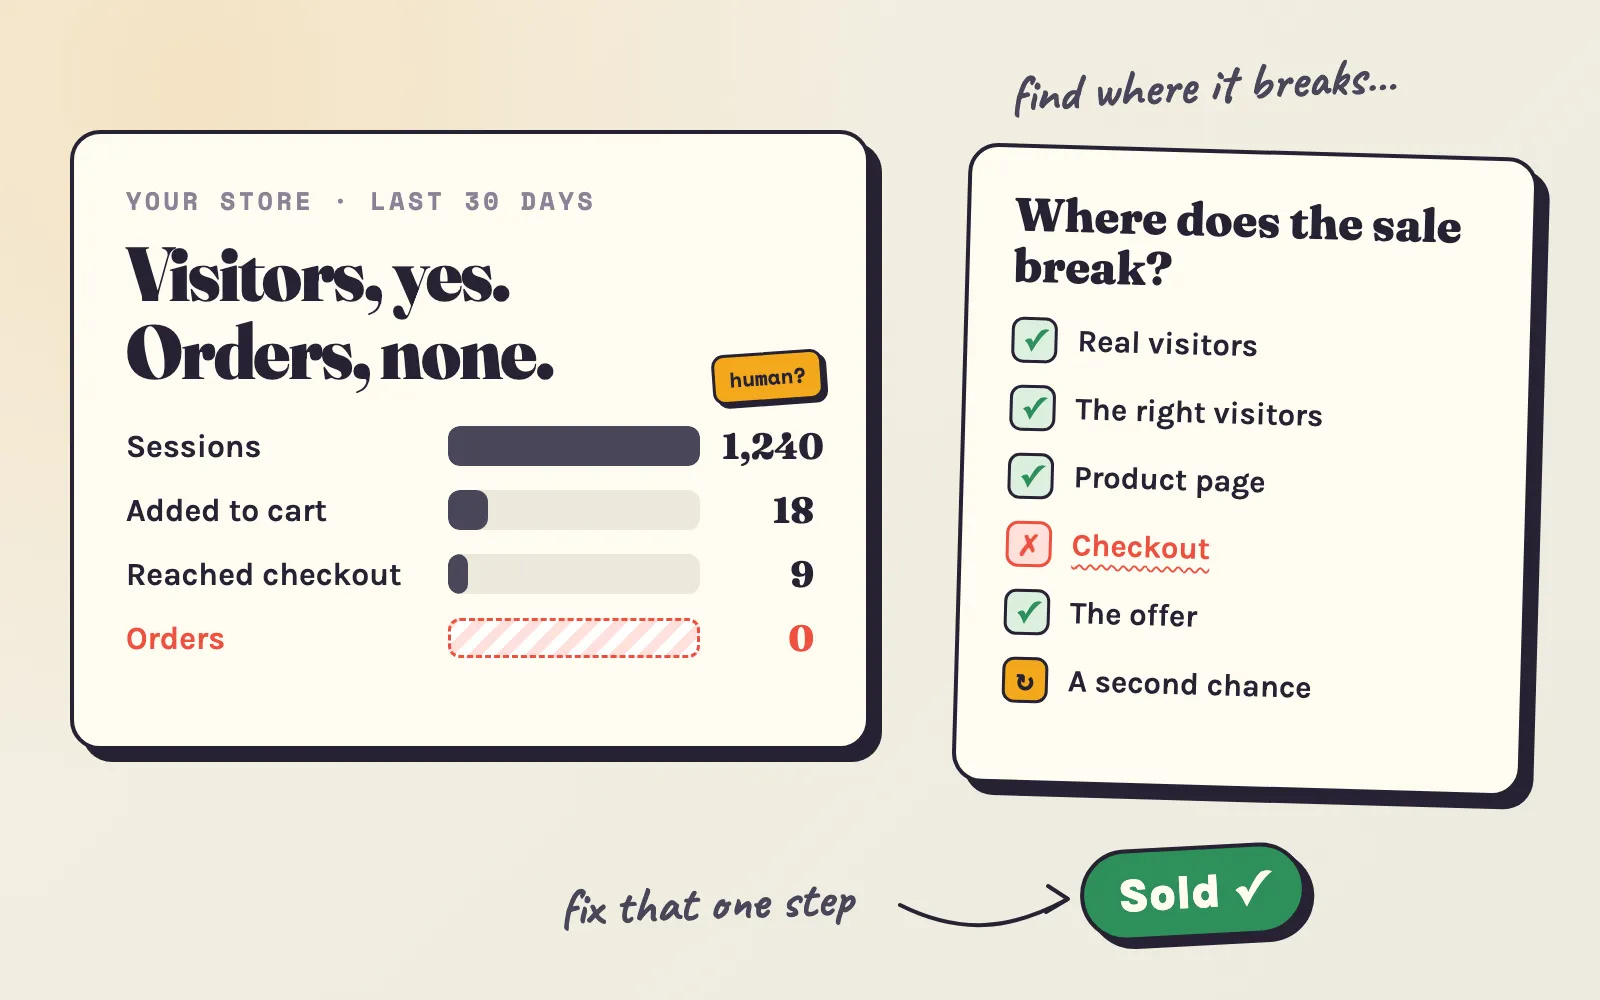

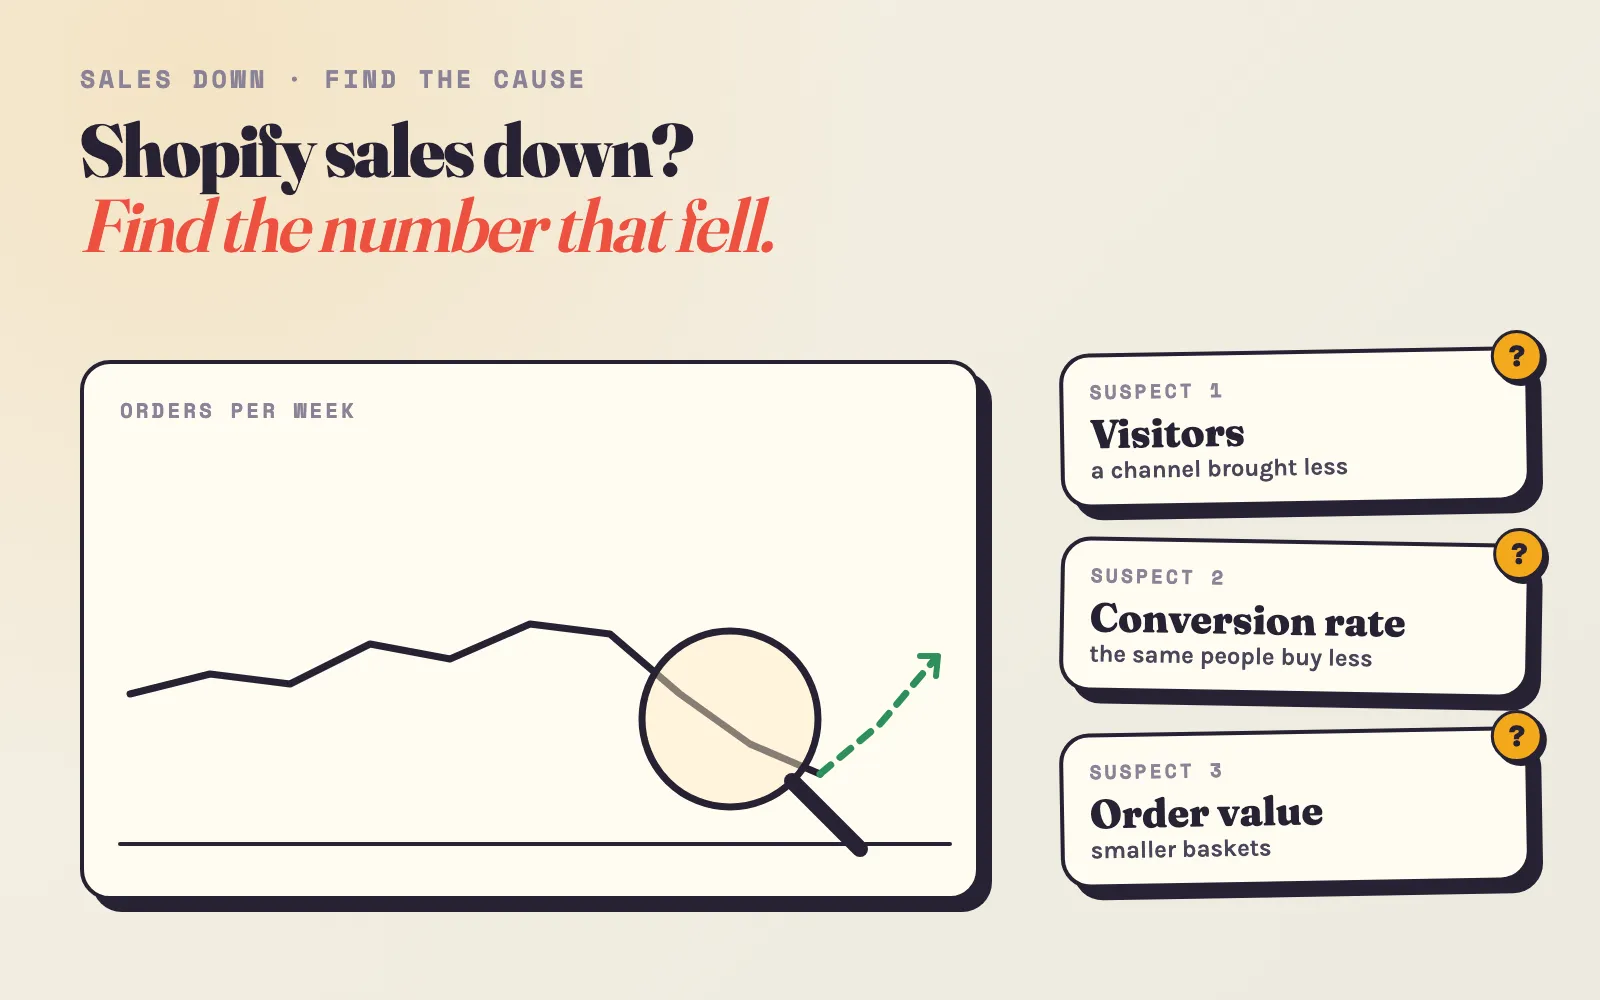
The chart was going up, or at least sideways. Then the orders slowed - suddenly, or week by week. “Sales just stopped” and “sales have dropped drastically since…” are some of the most common threads in the Shopify Community, and the answers there are usually a list of guesses.
You don’t need guesses. A drop in sales has a short list of possible causes, and your own numbers say which one is yours. This guide goes through it in the order that saves the most time: first check whether the drop is real, then find which number fell, then fix the cause - with the quick checks for a sudden drop and the longer plan for a slow decline.
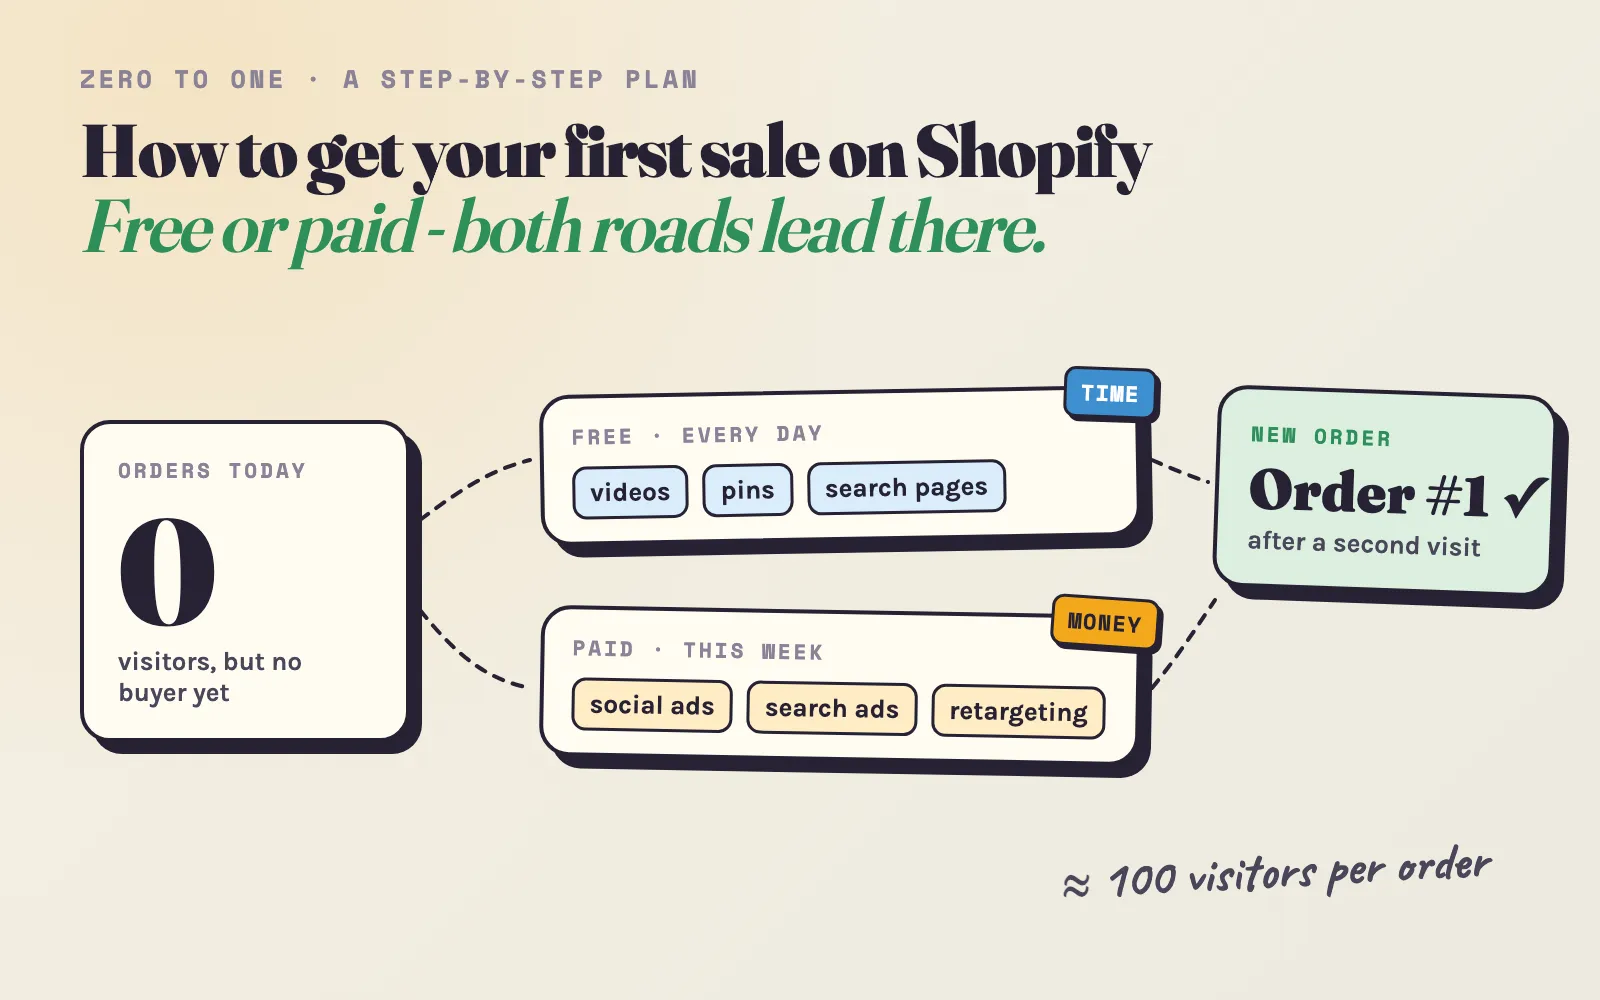
Never had sales to begin with? That is a different problem - start with how to get your first sale or no sales on Shopify.
- Is the drop real?Enough orders, the same days of the week, the same season - not a quiet week or a reporting change.Step 1
- Did it happen overnight?Then something broke: checkout, payment, stock, an ad account, a Google listing.Step 2
- Which number fell?Visitors, conversion rate or order value - each points to different causes.Step 3
- Fix that cause.A channel that weakened, a store that converts less, orders that got smaller.Step 4
- Win the sales back.Past visitors and customers first, then a second channel.Step 5
Step 1: is the drop real?
Before you change anything, make sure there is something to fix. Three things make a normal month look like a drop.
Chance: small numbers swing a lot
Orders arrive at random. A store that averages 40 orders a month does not get 40 every month - it gets 33 one month and 47 the next, without any cause. The fewer orders you have, the bigger the swings. In a sample of 253 Shopify stores, the stores with 6-15 orders a month had a whole week without a single order in 80% of their months - and they were not in decline, those were simply their normal months.
Put your own numbers in. Use two periods of the same length - for example the last four weeks and the four weeks before them:
- Change
- −30%orders, period to period
- Chance alone does this
- 9%of the time, at your volume
- A clear drop starts at
- 25 or fewerorders in the second period
Maybe a real drop. Chance could still explain it. Run the quick checks below today, and compare again in two weeks before you change anything big.
The calendar: seasons and holidays
Most products sell differently through the year, and the weeks around holidays move the most. A fresh example: in a sample of 33 Shopify stores, the two weeks before Black Friday 2025 ran about 8% below each store’s average day of October and early November - shoppers waited for the deals. Then Black Friday itself brought 1.76× a normal day (median store). If your sales slowed in the middle of November, you are probably looking at the wait, not a decline. More in our Black Friday guide.
Other dates that move sales: January after the holidays, the start of summer holidays, back-to-school for some categories, paydays at the start of the month, and local holidays in the countries you sell to. The fair comparison is the same period last year. In Shopify Analytics, set the date range and compare with the previous year, not the previous period.
Reporting: the numbers changed, not the sales
Sometimes the counting changes, not the store:
- Bot filter. Since October 2025, Shopify can filter sessions by human or bot (Shopify changelog). Sessions can fall when a bot source stops or when you switch on the filter - with no effect on orders.
- Ad platforms count differently. In 2026, Meta stopped reporting 7-day and 28-day view conversions and changed what counts as a click conversion. Your ad report can show fewer sales while Shopify shows the same orders - the details are in our guide to Meta ads not converting.
- Look at orders, not “sales”. Shopify’s “total sales” subtract returns and add shipping and taxes. A wave of returns or a tax change can move it without fewer orders.
The rule: judge on orders in Shopify, over four weeks or more, against the same season. If the drop survives all three, it is real - keep going.
Step 2: a sudden drop? Check for a break today
If orders fell from one day to the next - not week by week - something almost certainly broke. These checks take 30 minutes, and they find most sudden drops:
- Can you buy?Place a real order on your phone and on a computer, in a private window, as a stranger would. Add to cart, checkout, pay.
- Are all payment methods there?Shop Pay, PayPal, Apple Pay, cards. An app update or a payment provider review can remove one without telling you.
- What changed in the last days?A theme update, a new app, an app update, a new pop-up, a shipping rule. Undo the last change and test again.
- Are the best-sellers in stock?Sort products by sales: a sold-out top product can take a third of the orders with it.
- Are the ads running?Ad accounts get paused for a failed payment, a policy review or a disapproved ad. Check every account, not just the dashboard.
- Is Google showing your products?In Google Merchant Center, look for disapproved products or an account warning. A suspension removes both your Shopping ads and your free listings.
- Do the emails go out?Check that your automations - welcome, abandoned checkout, post-purchase - are on and sending.
- Is it everyone, or only you?Shopify's status page and your payment provider's status page. If they show an incident, wait and note the dates.
Apps break things more than people think. Merchants in the Shopify Community regularly report the same pattern: the store loads fine, but an app or theme update silently broke the add-to-cart button, a cart drawer or a payment option. The fastest test: open the store in a private window, try to buy, and if it fails, switch off the apps you changed most recently one by one.
Step 3: find the number that fell
If nothing broke and the drop is real, find which part of your sales fell. Every store’s sales are three numbers multiplied:
Visitors are real (human) sessions. Conversion rate is the share of sessions that end in an order. Average order value is sales divided by orders.
In Shopify Analytics, set the period with the drop and compare it with the same period before (or last year). Note the three numbers:
| What fell | What it usually means | Go to |
|---|---|---|
| Visitors - and the conversion rate held | A traffic source brought less: ads, Google, email, social or a partner | Fewer visitors |
| Conversion rate - visitors held | The store sells less to the same people: something changed in it, in your offer or in the competition | Lower conversion |
| Average order value - orders held | Smaller baskets: discounts, a changed product mix, a free-shipping threshold, bundles | Smaller orders |
| Visitors and conversion together | A new kind of visitor: a new campaign, a viral post or a bot source with weaker buyers | Compare conversion by source |
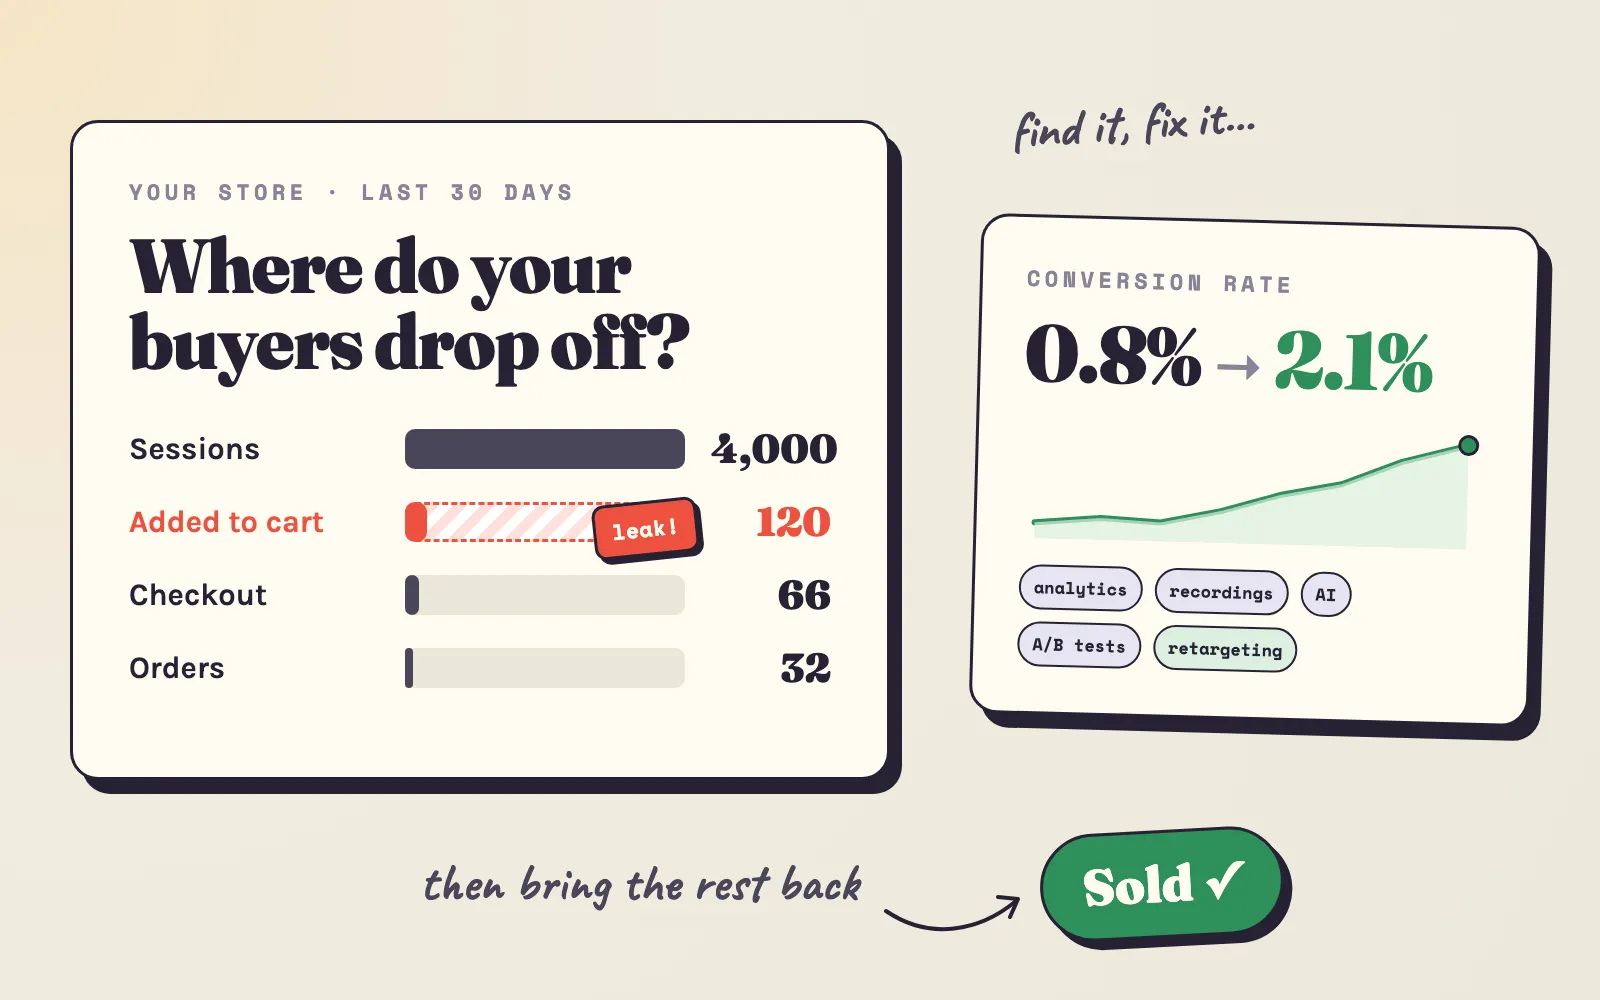
Then go one level down: sessions and orders by traffic source (in Shopify, the reports by referrer and by channel). Most drops sit in one source. “Sales fell 25%” is hard to fix; “visitors from Instagram ads fell by half since the 3rd” is not.
Step 4: fix the cause
Fewer visitors: a channel weakened
Paid social (Facebook, Instagram, TikTok). The most common cause of a slow decline. Your best ad wears out as the same people see it again and again, and ad prices rise - Meta’s average price per ad was up 12% year on year in mid-2026 (Meta 10-Q), and the last quarter of the year is always the most expensive. Signs: the click-through rate falls week by week, the cost per visitor rises. Fixes:
- New creatives every two to four weeks - new ideas, not new colours. Keep a list of what you tried.
- Don’t switch off what still works. Lower the budget instead, and add new ads next to the old winner.
- Check that tracking still works - Shopify can pause an app pixel that sends too little data. If Meta stopped seeing your orders, it stopped finding your buyers.
Google - free results. If visitors from Google search fell on certain dates, look at Google’s Search Status Dashboard: 2026 had core updates in March and May. In Google Search Console, compare clicks per page before and after. Another reason is quieter: AI answers on top of the results take clicks from the links below them - a randomized field study found that AI Overviews cut outbound clicks by about 40% on the searches where they appear (PPC Land, working paper). What helps: pages that an AI answer cannot replace - your own photos, real measurements and details, honest buying guides, reviews from real customers.
Google - Shopping ads and free listings. In Merchant Center, check the number of approved products. A price or availability on the feed that differs from the store, a missing return policy or a shipping error can disapprove products or suspend the account - and a suspension stops Shopping ads and free listings together (Google).
Email. Fewer opens and clicks over a few months often means your emails moved to spam. Since 2024 Gmail and Yahoo - and since May 2025 Microsoft - require senders to authenticate their domain and keep spam complaints low (Google’s limit: 0.3%). In your email app, check that your domain is verified, remove people who have not opened in six months, and make unsubscribing easy.
One source was most of your traffic. That is the real risk behind many declines. In a sample of 112 Shopify stores, Facebook and Instagram were part of at least half of all orders in 16 stores (January-September 2026). For a store like that, one change at one platform - prices, delivery, counting - moves the whole business. The fix is in step 5.
The same visitors buy less
If the number of visitors held but fewer of them buy:
- Compare your offer again. Search for your product as a shopper would. Is a competitor - a new store, a marketplace seller, an AI shopping answer - now cheaper, faster or better reviewed? Price is rarely the only fix: a bundle, a guarantee or faster delivery can win back the difference.
- Check prices, shipping and taxes. A supplier price increase you passed on, a new shipping rate or a free-shipping threshold you raised. For stores that ship into the US from abroad, duties changed in 2025: since August 29, 2025, small parcels no longer enter the US duty-free - shoppers who now pay more at the door order less.
- Read the latest reviews. A run of bad reviews about delivery or quality on a top product shows up on the product page - and in the sales.
- Test the speed on a phone. A new app or a heavy video on the home page can slow every page. Run your top product page through PageSpeed Insights and remove what you don’t need.
- Look at the conversion rate by device. If phones fell and computers did not, something on the mobile layout broke.
The step where shoppers stop - product page, cart or checkout - tells you where to look. The leak finder in our conversion rate calculator compares each step with a typical store, and our conversion rate guide has the fixes.
Smaller orders
If the number of orders held but each order got smaller:
- Discounts that became permanent. A code that spread on coupon sites, or a sale that never ended.
- The product mix shifted. A cheaper product took the place of a best-seller - often because the best-seller sold out or lost its ads.
- Bundles or upsells stopped. An app that showed “frequently bought together” or a cart upsell was removed or broke.
- The free-shipping threshold. Set it a little above your average order - $65 when the average order is $55 - so customers add one more item to reach it.
Step 5: win the sales back
When you know the cause and fixed it, sales still don’t return by themselves - the shoppers you lost in the meantime went somewhere else. Win them back in the order of what costs the least:
1. The people who already bought from you. They know your store and trust it. Send past customers an email with something new - a new product, a restock of a favourite, a small thank-you code. If you have not emailed them in months, start with your best customers.
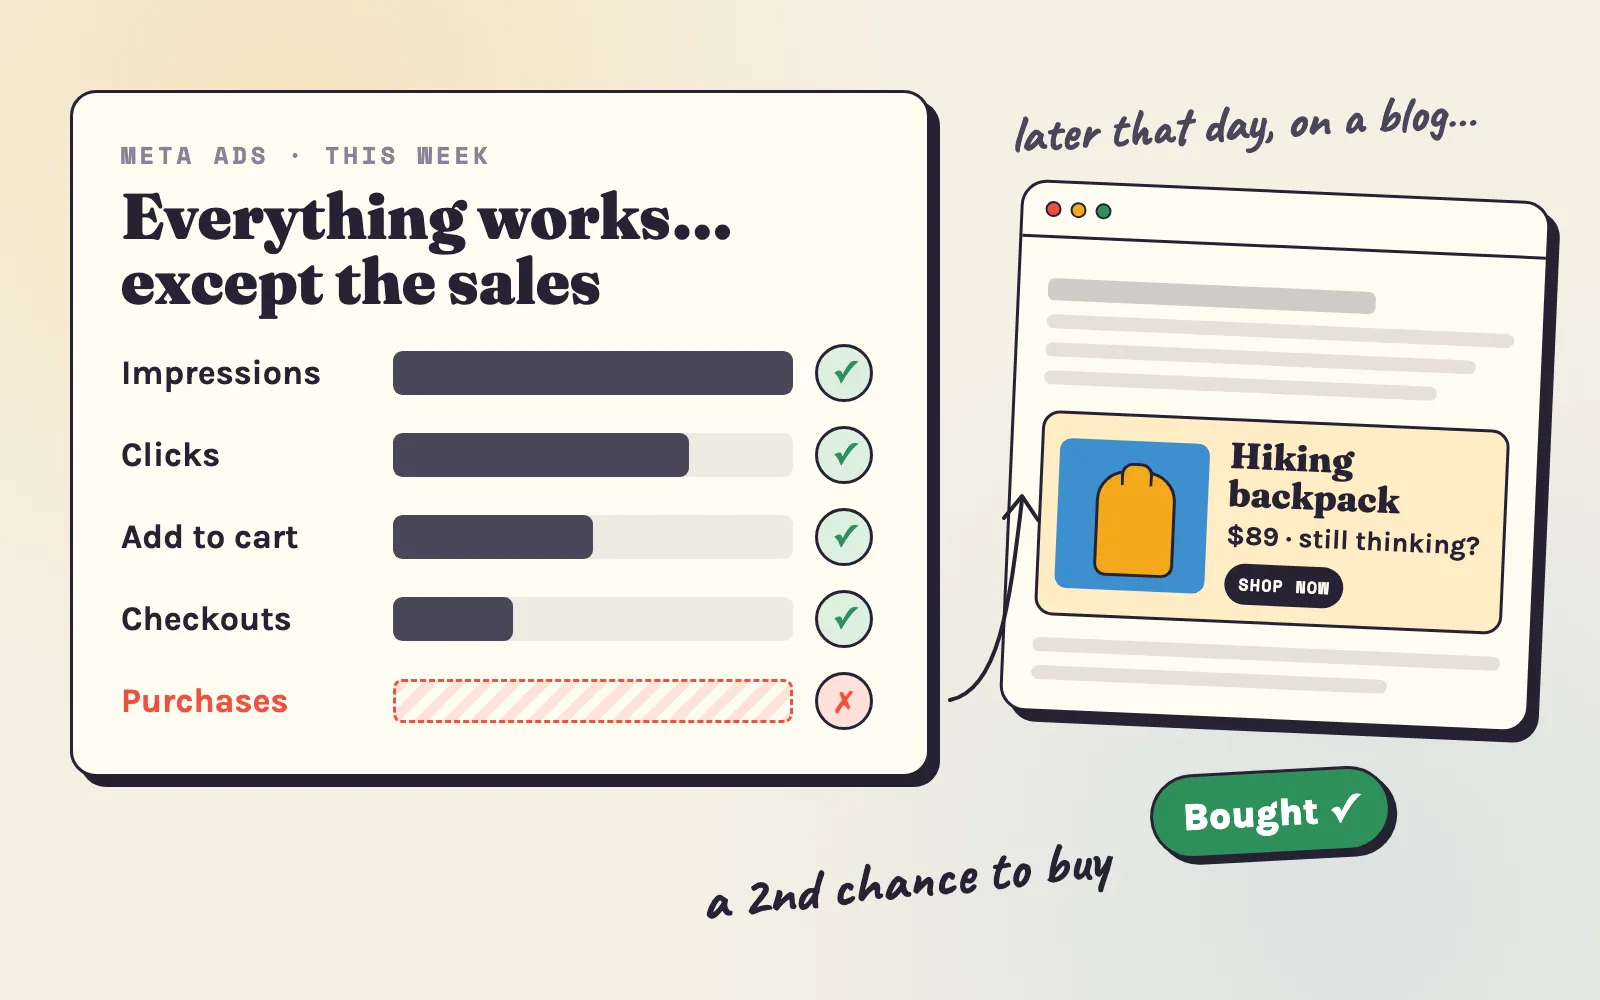
2. The people who visited and did not buy. Many buyers need more than one visit: in a sample of 112 Shopify stores, 43% of orders came after two or more visits (median store). If your store lost visitors, it also lost the second visits that would have come later.
- The abandoned checkout email reaches the shoppers who got furthest - check it is on under Marketing > Automations.
- Retargeting reaches the rest - most visitors never leave an email. Retargeting shows them the products they looked at, later, on other websites and apps. In our data, retargeting ads were clicked 6 to 12 times more often than ads to new shoppers.
3. A second channel for new shoppers. If one platform brought most of your visitors, the decline was a warning. Add a channel that works differently from it:
- Google Shopping if people search for your type of product - it catches shoppers at the moment they want to buy.
- Pinterest and short videos if your product is visual - slower, but free.
- Adeagle if you want a channel that runs next to your others with little work. It shows your products as ads in other Shopify stores, in shopping apps and on niche websites that match what you sell, and it brings back the visitors of every channel with retargeting. You install it from the Shopify App Store, it reads your product feed by itself, and a campaign takes about a minute to set up. In September-October 2026, 80% of its banner views were in apps - places where shoppers browse outside Facebook and Instagram.
A two-week plan
| When | What to do |
|---|---|
| Day 1 | Check that the drop is real (the tool above, the same season). Run the same-day checklist: test order, payment methods, recent changes, stock, ad accounts, Merchant Center, emails. |
| Days 2-3 | Find the number that fell - visitors, conversion rate or order value - and the traffic source where it fell. Write down the date it started. |
| Days 3-7 | Fix that cause: new creatives, a restock, a reverted app, a fixed feed, a fair shipping price. One change at a time, so you see what worked. |
| Week 2 | Email past customers. Check the abandoned checkout email. Start retargeting for recent visitors. Add a second channel if one source held most of your traffic. |
| Week 4 | Compare four weeks with the same four weeks before the drop - with the tool above, not by feel. |
How to notice the next drop early
- Look at the same three numbers every Monday - visitors, conversion rate and average order value, against the week before and the same week last year. Five minutes.
- Place a test order after every theme or app update. Most silent breaks come from an update.
- Tag every link you share - ads, emails, creators - with the UTM builder, so the referrer report shows which source fell.
- Keep no channel above about half of your sales. A second channel is not only growth; it is insurance.
A drop in sales feels like a verdict on your store. Usually it is one broken step, one weaker channel or one season - and your numbers tell you which. Check that it is real, find the number that fell, fix that one, and bring back the shoppers who already knew you.
Want a second channel that also brings back the visitors of your others? Add Adeagle from the Shopify App Store, follow the getting started guide, and compare the plans on the pricing page.
Sources: Shopify changelog, human and bot sessions; Meta’s ad prices - Meta 10-Q, second quarter 2026; Google updates - Google Search Status Dashboard; AI Overviews and clicks - Agarwal and Sen, working paper, via PPC Land; Merchant Center suspensions - Google Merchant Center Help; email sender rules - Google and Yahoo Sender Hub. Adeagle data: our own ad serving (August-October 2026) and, for orders and visits, Shopify’s record of each order in samples of stores using Adeagle (2025-2026).
Questions
Usually for one of three reasons - fewer visitors (an ad channel, Google or email brought less), the same visitors buying less (something in the store broke, a best-seller sold out, prices or shipping changed, a competitor got cheaper) or smaller orders. Compare this period with the same period before, in Shopify Analytics, for sessions, conversion rate and average order value - the number that fell points to the cause.
A sudden drop - from one day to the next - is almost always a break, not a trend. Place a test order on your phone, check that every payment method still appears, look for a theme or app update in the last days, check that your best-sellers are in stock, and look for a disapproval or suspension in your ad accounts and Google Merchant Center.
Some ups and downs are. Orders arrive at random, so a store with 40 orders a month can have a month with 28 by chance alone. Seasons matter too - in our data, stores sold about 8% less per day in the two weeks before Black Friday 2025 than in their average day of October. Compare the same season and enough orders before you change anything.
Often because bots left your numbers. Shopify added a filter for human and bot sessions in October 2025, and a source that sent bots - or a bot that stopped visiting - changes your session count without changing sales. If orders hold, your real visitors are fine.
Either the store changed - a slow app, a broken button, a new shipping price, a sold-out best-seller - or the visitors changed. A new ad campaign, a viral post or a bot source brings visitors who buy less, and the rate falls even though nothing in the store is wrong. Look at the conversion rate per traffic source to see which.
Find the number that fell and fix its cause first. Then bring back the people who already know you - an email to past customers, the abandoned checkout email and retargeting for recent visitors - because they buy far more often than strangers. Finally add a second traffic channel, so a change at one platform can never take half of your sales again.
Possibly, if your traffic from Google search fell on the dates of an update - Google lists them on its Search Status Dashboard. Check Search Console for the pages that lost clicks. Recovery comes from more useful pages - original photos, real product details, honest guides - not from quick fixes, and usually shows only after the next update.