
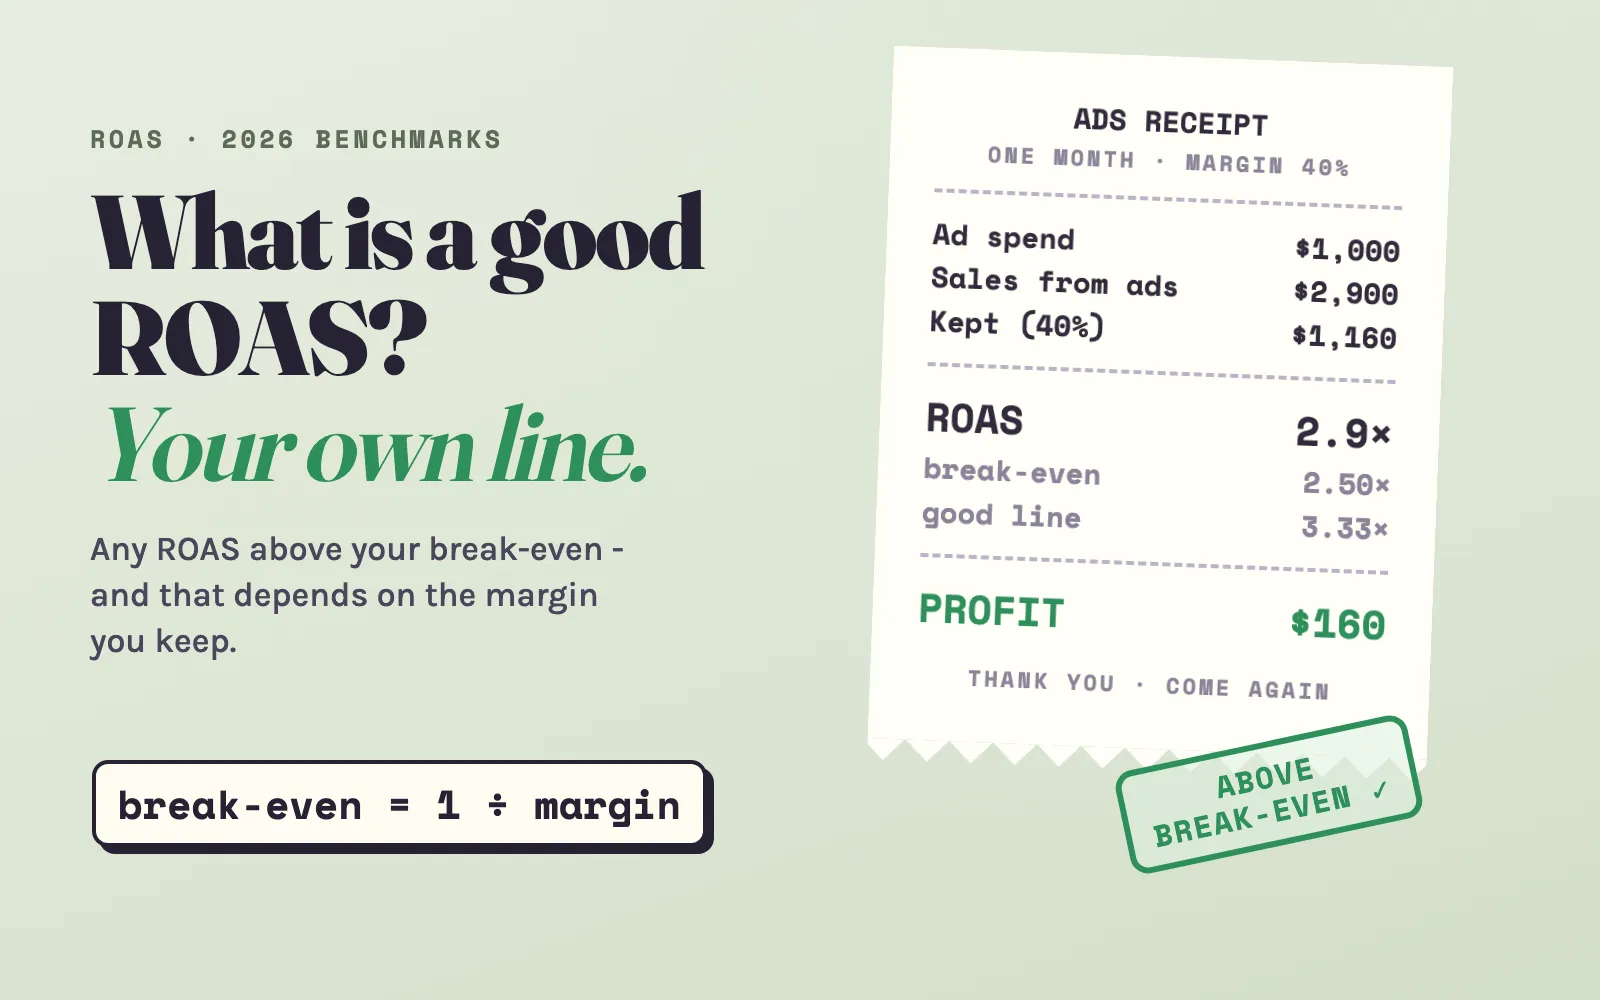
Every ad platform reports ROAS. Few tell you whether yours is good. The honest answer is short: a good ROAS is any ROAS above your own break-even line, and that line depends on how much of each sale you keep. This guide shows how to find it in a minute, what other stores get in 2026, and why your three ad reports never agree.
What ROAS means
ROAS - return on ad spend - is the revenue your ads brought, divided by what the ads cost. $2,900 in sales from $1,000 of ads is a ROAS of 2.9×, written also as 2.9:1 or 290%. Every dollar of ads brought $2.90 in sales.
ROAS says nothing about profit. Those $2,900 still have to pay for the products, shipping, payment fees and the ads themselves. That is why the same 2.9× can be a great result for one store and a loss for another.
The short answer: above your break-even ROAS
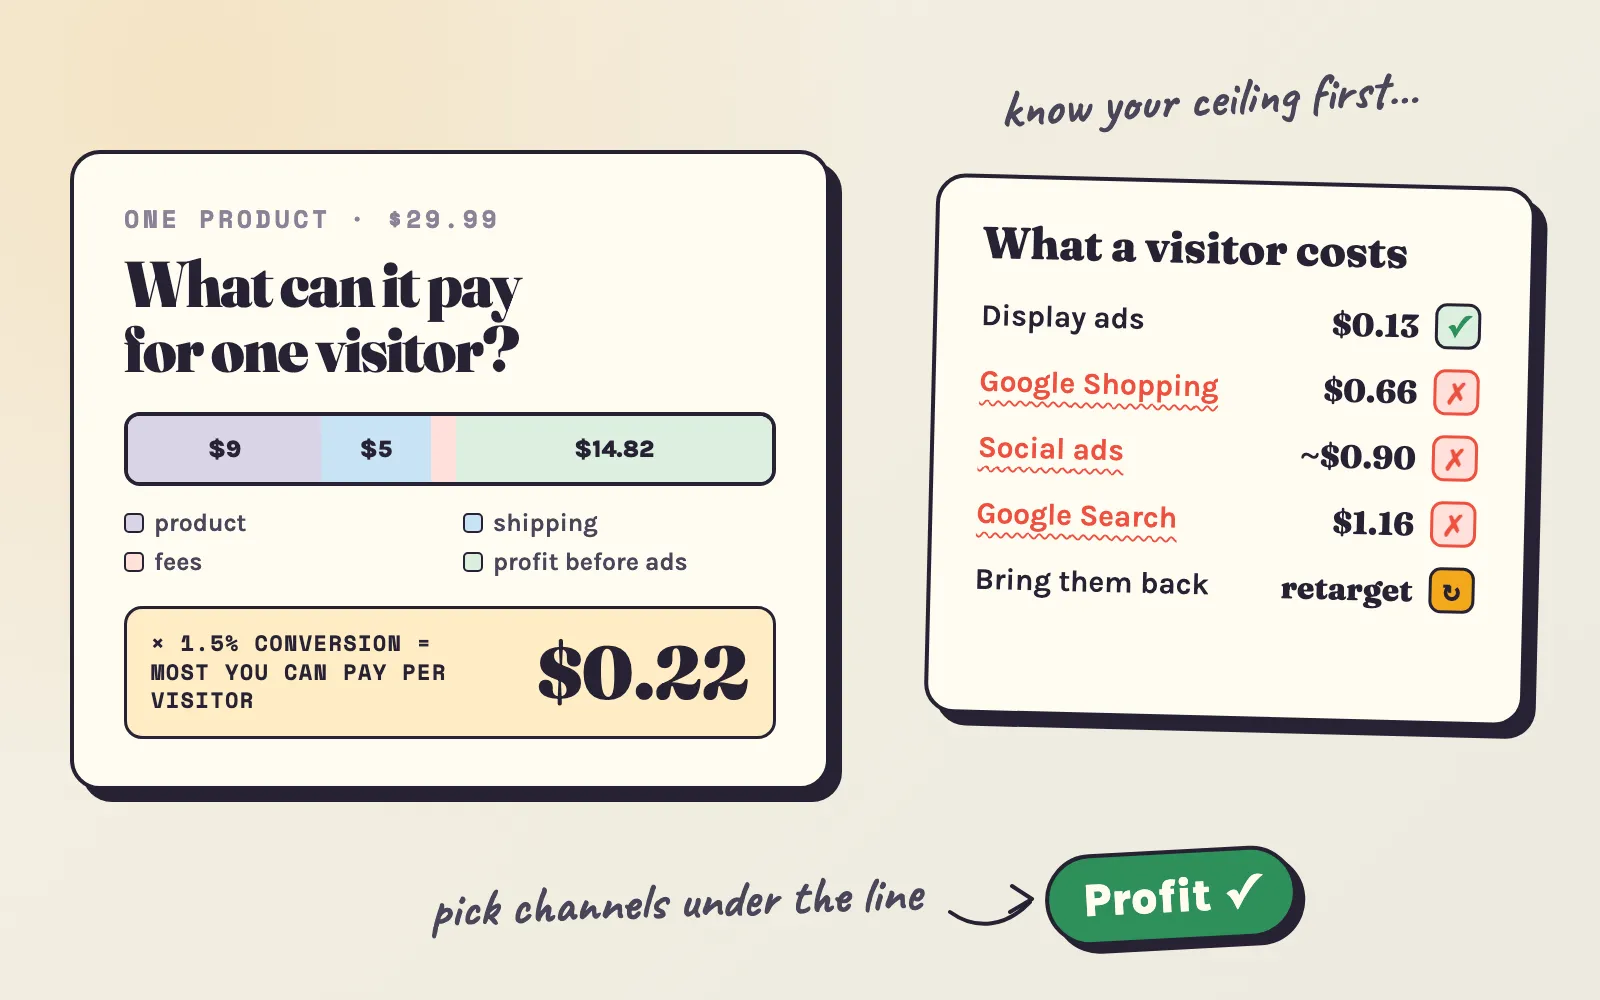
Break-even ROAS = 1 ÷ your profit margin before ads. Margin before ads is what you keep from an order after product cost, shipping and payment fees, as a share of the order value. A $60 order that costs $30 to make, ship and process has a 50% margin - it breaks even at 1 ÷ 0.5 = 2×.
Break-even keeps the lights on but makes nothing. A practical “good” line is the ROAS at which you still keep 10% of your sales as profit after ads: 1 ÷ (margin − 10%).
| Margin before ads | Typical for | Break-even ROAS | Good ROAS (keeps 10% of sales) |
|---|---|---|---|
| 20% | resold branded goods | 5.00× | 10.00× |
| 30% | home decor, furniture | 3.33× | 5.00× |
| 40% | dropshipping | 2.50× | 3.33× |
| 50% | apparel | 2.00× | 2.50× |
| 60% | beauty, own-brand goods | 1.67× | 2.00× |
| 70% | jewelry, handmade, digital | 1.43× | 1.67× |
Why “4× is a good ROAS” misleads most stores. 4× is simply the break-even ROAS of a store that keeps 25% of each order. Stores with higher margins make money far below it, and stores with thinner margins lose money above it.
Is my ROAS good? Check it in ten seconds
- Break-even ROAS
- 2.50×1 ÷ margin
- Good ROAS
- 3.33×keeps 10% of sales
- 2026 medians
- 1.88× · 2.87×Meta · Google Ads
Profitable, but thin. You clear break-even (2.50×) and keep $160 a month, but to keep 10% of your sales as profit you need 3.33×. Fine for ads that win new customers who come back; tight for everything else.
For more detail - order value, product cost and fees one by one - use the ROAS and break-even ROAS calculator.
ROAS benchmarks for 2026
Benchmarks are useful to see whether a number is unusual, not to decide whether it is good - your margin does that. These are the most solid 2026 figures we found, all as the ad platforms report them:
Three things stand out:
- Search on your own brand name has the highest ROAS - and the least meaning. Many of those shoppers were already looking for you. In the same Google Ads study, the middle half of accounts ranged from 1.68× to 5.41×; brand campaigns lift the top.
- Ads to new shoppers sit around 2×. Meta’s median of 1.88× and Shopping’s 2.30× are mostly people who never heard of you. That is below break-even for any store with a margin under about 50% - which is why those ads have to be judged by the customers they win, not by the first order alone (see below).
- Retargeting shows the most. People who already looked at a product buy far more often when they see it again.
Why your ROAS reports never agree
Open Meta Ads Manager, Shopify Analytics and your bank account, and you get three different ROAS numbers for the same month. None of them is lying - each one counts different sales:
| Report | Counts a sale when | Usually shows |
|---|---|---|
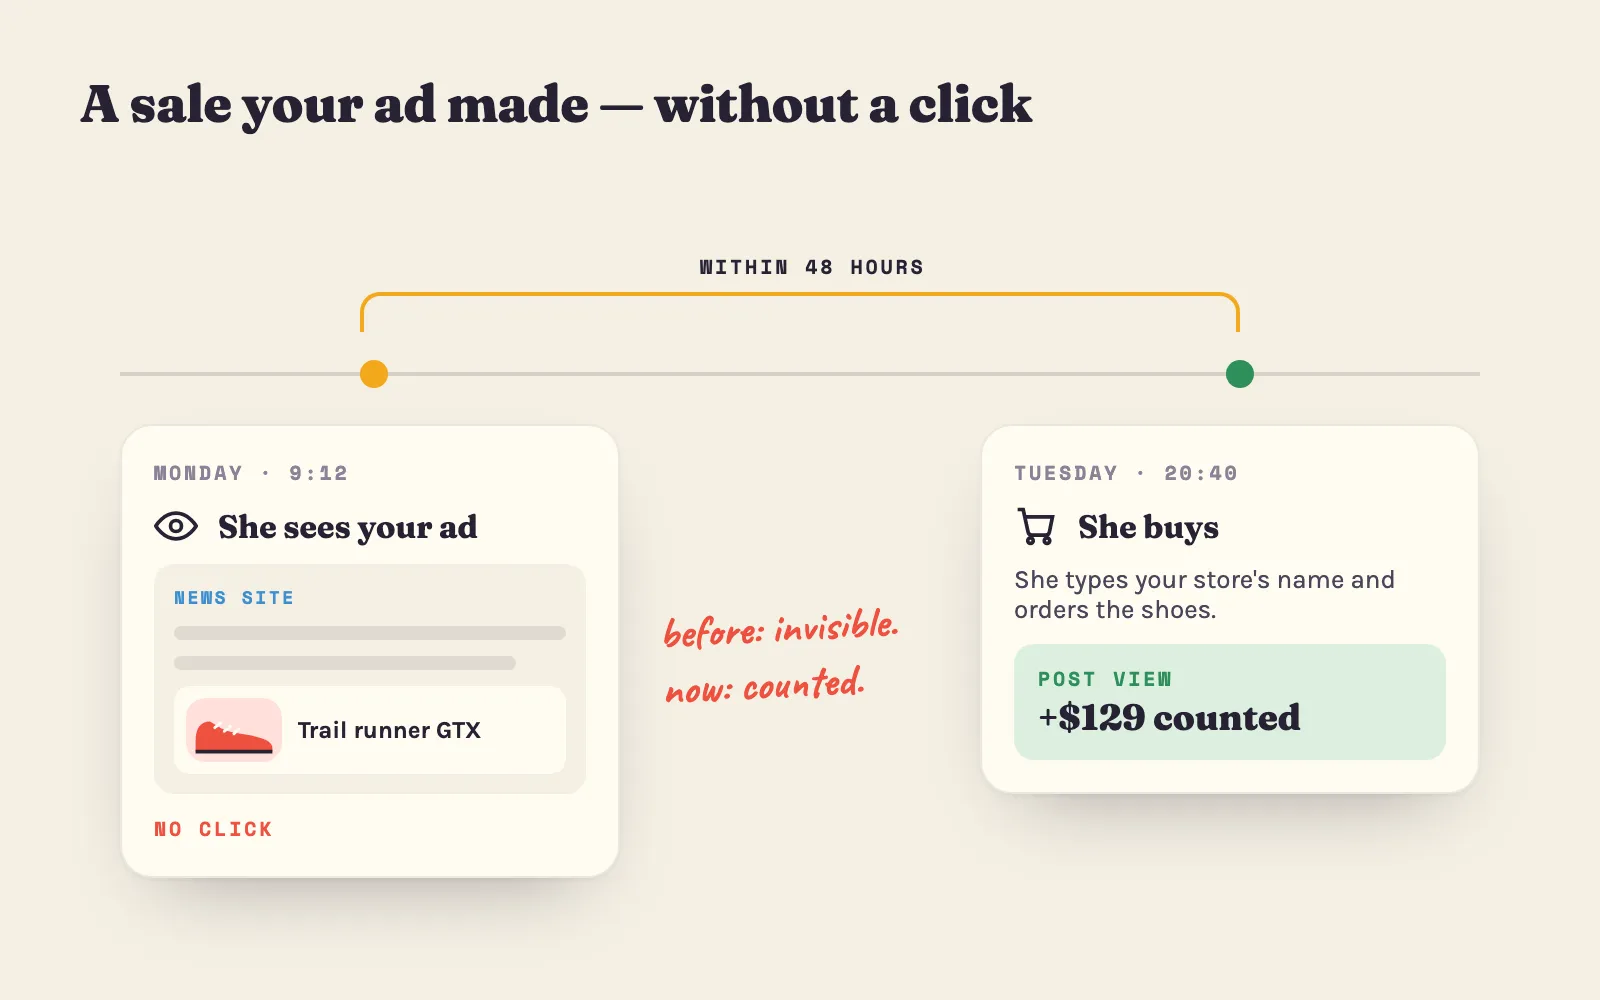
| The ad platform (Meta, Google) | someone clicked - or only saw - the ad within its window, also if they came back another way | the highest ROAS |
| Shopify, last click | the last visit before the order came from that channel | a lower ROAS for ads that start sales |
| Blended (MER) | every order, divided by all ad spend | the one that pays your bills |
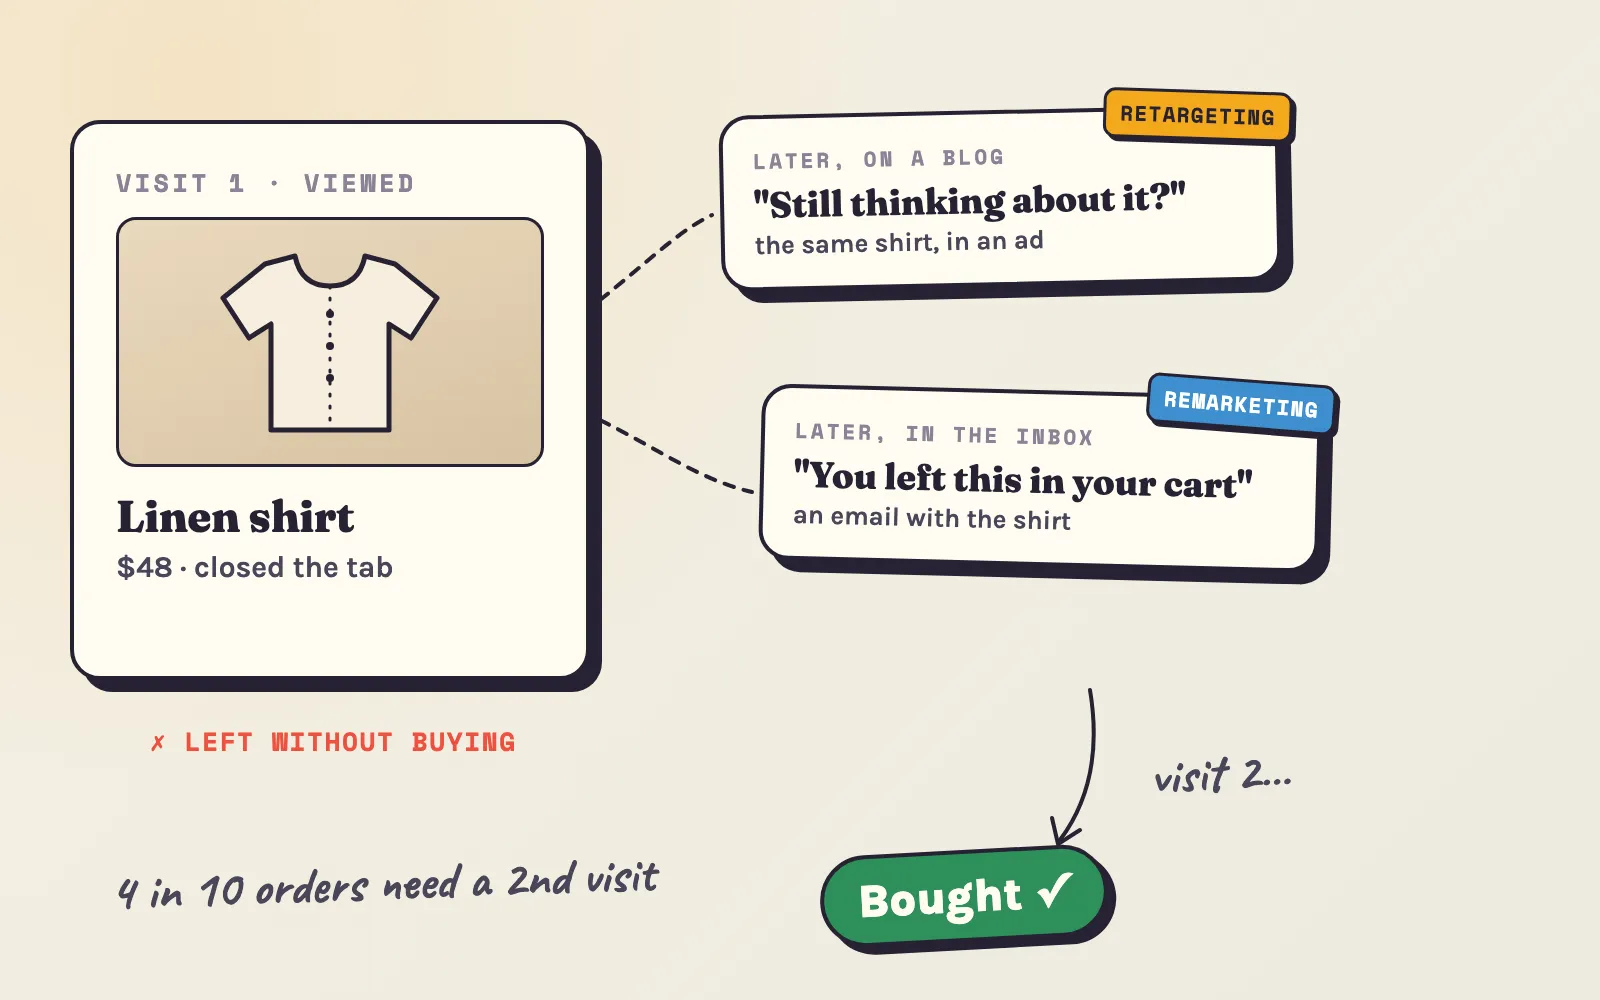
Our own data shows why the gap exists. Shopify records every visit before an order. In a sample of 28 Shopify stores - about 15,600 orders with at least one Facebook or Instagram visit, February to September 2026 - 6 in 10 of those orders took two or more visits, and 1 in 10 was finished on a visit from somewhere else: the address typed in, a search, an email. Meta counts those orders as its own. Shopify’s last-click report gives them to the last visit.
Expensive products widen the gap. In a sample of Shopify stores (51 to 61 per price band, about 57,000 orders), 43% of orders under $30 came after two or more visits - and 53% of orders of $120 and more. The more a shopper thinks before buying, the more a last-click report shortchanges the ads that started the sale.
So:
- Use the platform report to compare ads with each other inside one platform.
- Use Shopify to check the platform - if Meta claims twice as many sales as Shopify gives it, look at the view-through share before you raise the budget.
- Use blended ROAS to decide the budget.
Blended ROAS (MER): the number that pays the bills
Blended ROAS, also called MER (marketing efficiency ratio), is your total sales divided by your total ad spend - all channels, all orders, also the ones no ad report claims. $12,000 in monthly sales from $3,000 of ads is a blended ROAS of 4×.
It is the safest single number for a small store because no attribution can inflate it. Its break-even line is the same 1 ÷ margin, but measured over all orders - including repeat customers and people who came on their own. If your blended ROAS falls while every platform reports a stable ROAS, your ads are taking credit for sales that would have happened anyway.
| Metric | Formula | It answers |
|---|---|---|
| ROAS | revenue from ads ÷ ad spend | Do these ads bring sales? |
| Break-even ROAS | 1 ÷ profit margin before ads | What ROAS do I need? |
| Blended ROAS (MER) | all revenue ÷ all ad spend | Is my advertising working as a whole? |
| ROI | (profit from ads − ad spend) ÷ ad spend | Do these ads make money? |
| POAS | gross profit from ads ÷ ad spend | ROAS with margins built in - above 1 is profit |
ROAS vs ROI in one example: $1,000 of ads bring $2,900 in sales, a ROAS of 2.9×. At a 40% margin those sales leave $1,160, minus the $1,000 of ads: $160 profit, an ROI of 16%.
A good ROAS depends on what the ad is for
Ads that find new customers
A first order at break-even - or even a little below - can be a good deal if the customer comes back. A store whose customers order three times a year can afford to “lose” the first order. Judge these ads by:
- cost per new customer, against what a customer is worth over a year (the customer lifetime value calculator shows it), and
- blended ROAS over two to three months, not the ad report of one week.
Ads that bring visitors back
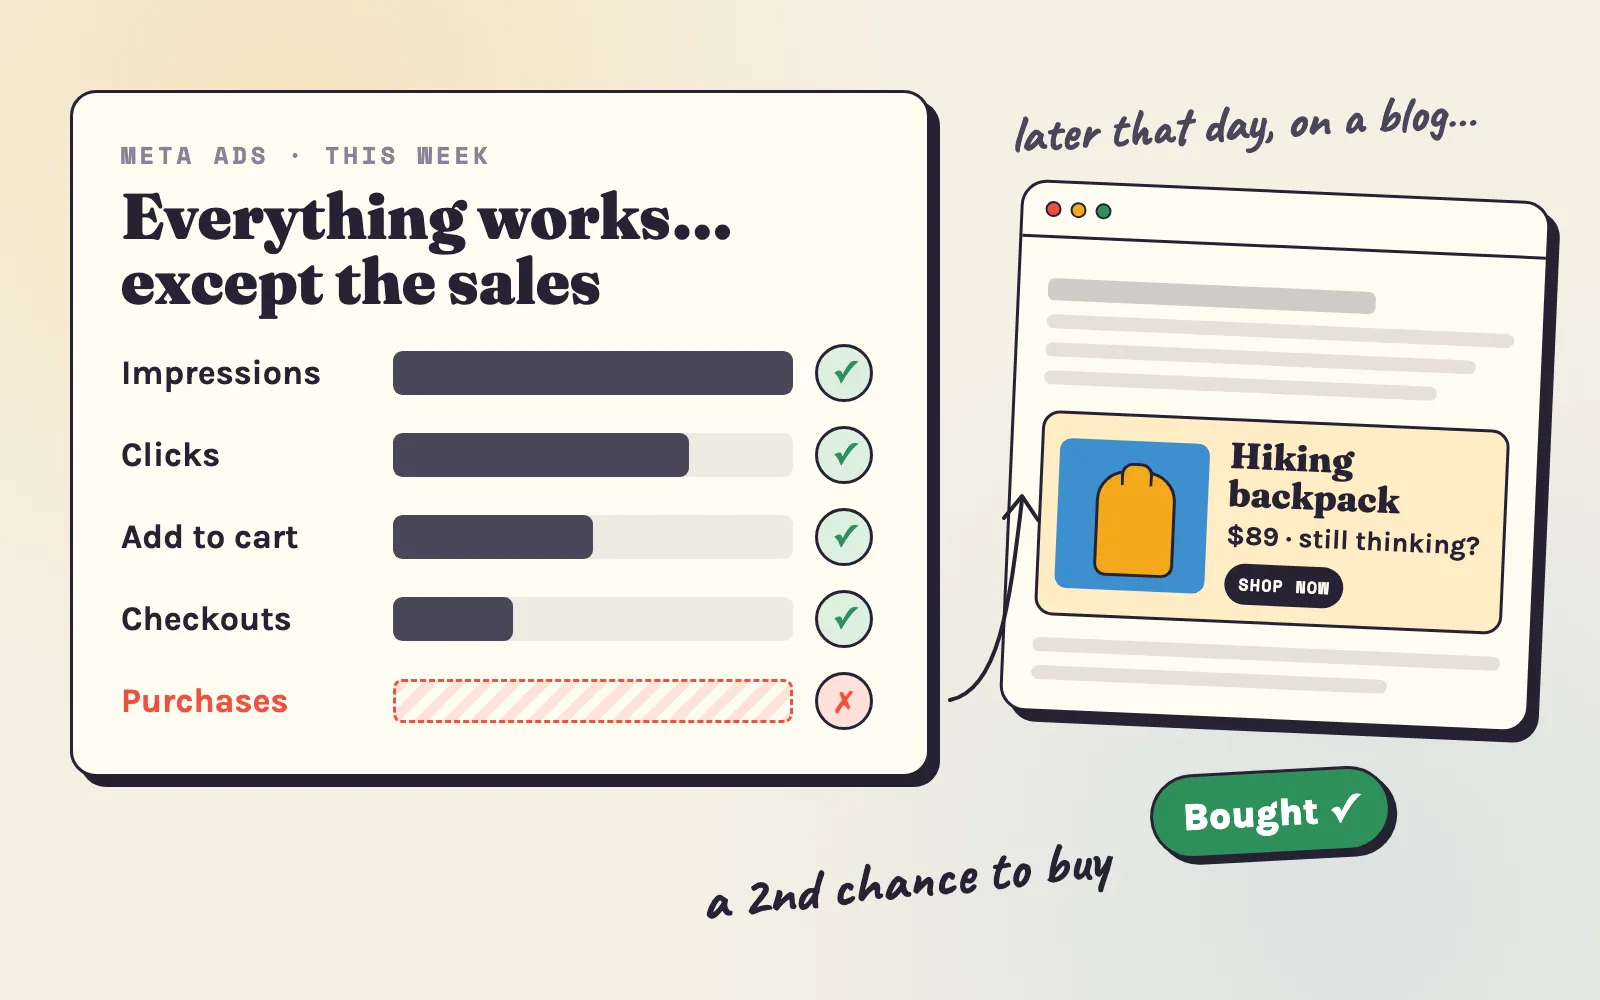
Retargeting shows people the products they already looked at. Its ROAS should be well above break-even, because these shoppers already chose you once. If your retargeting ROAS is barely above your new-customer ads, the audience is too wide or the ads show too often.
The whole budget
A healthy mix often looks like this: new-customer ads near break-even, retargeting well above it, and a blended ROAS that leaves the profit you planned.
What we see on Adeagle
Retargeting is where display ads pay. Shoppers who already viewed a product and see it again buy far more often. In July–September 2026, across 208,000 retargeting impressions for a sample of 9 stores in 7 verticals - apparel, home & garden, toys, car parts, food, luggage and hardware - each 1,000 retargeting impressions brought $16.47 in post-click sales (orders placed after a shopper clicked the ad). On plans with retargeting, at the default 20% retargeting share that works out to an estimated 3.1× ROAS (post-click), and about 5.0× at the maximum 33%.
How Adeagle helps: Adeagle shows your products to shoppers on other Shopify stores, blogs and shopping apps that match what you sell, and on the Professional and Ultimate plans it brings back the visitors who looked at your products and left. Your dashboard shows the sales from clicks and from views separately (post-view conversions), so you can compare the number with Meta’s and Google’s the honest way. See the plans with retargeting or install Adeagle.
How to raise your ROAS
ROAS has two halves - sales per visitor and cost per visitor. The changes that move it, roughly in order of effort:
- Raise the order value. Bundles, “complete the look” offers and a free-shipping threshold just above your average order raise the revenue of every ad click at no extra ad cost.
- Stop paying for the wrong visitors. Check ROAS by country, placement and audience; cut the bottom fifth instead of the whole campaign.
- Show the product that was clicked. Ads that land on a collection page or the home page lose buyers - link each ad to its product.
- Fix the product page before the ads. Missing sizes, unclear shipping costs and no reviews waste every visitor you pay for. Our guide to Shopify conversion rate lists the ten most common leaks.
- Bring visitors back. With 4 in 10 orders needing a second visit, an abandoned-cart email and retargeting turn the first ad’s cost into a sale (retargeting vs remarketing).
- Refresh creative every few weeks. The same image shown too often gets fewer clicks and a higher cost per sale.
- Plan for the season. Ad prices peak from mid-November to Cyber Monday; a lower ROAS then can still be fine if order values rise too (Black Friday marketing strategy).
- Raise prices or margins where you can. A margin from 40% to 45% moves your break-even from 2.5× to 2.2× - the same ads suddenly make money.
When a low ROAS is fine - and when it isn’t
Fine: a new campaign in its first two weeks; ads to new customers whose second order you can count on; a product launch you pay to make known; a season where everything costs more.
Not fine: retargeting below break-even; a blended ROAS that falls three months in a row; a platform ROAS that looks good while Shopify sales stay flat. If Meta stopped converting for you this autumn, our guide to why Meta ads aren’t converting walks through the 2026 changes one by one.
Free tools for your ROAS
- ROAS and break-even ROAS calculator - from order value, costs and spend.
- CPA calculator - the most you can pay per order.
- Customer lifetime value calculator - what a new customer is worth.
- CPC calculator - the most you can pay per click.
Sources: Meta ecommerce median - Triple Whale, Facebook ads benchmarks 2026; Google Ads medians - Harucon Ventures, Google Ads ecommerce study (38 accounts, May to mid-August 2026, as each account reports conversions); Meta counting changes - PPC Land on attribution windows, Jon Loomer on link-click attribution; Adeagle data on retargeting sales (a sample of 9 stores, July–September 2026) and on visits per order (Shopify’s record of each order’s visits, 2026).
Questions
Any ROAS above your break-even ROAS - 1 divided by your profit margin before ads. At a 50% margin you break even at 2× and keep 10% of your sales as profit at 2.5×. At a 30% margin you need 3.3× to break even and 5× for the same profit.
Only if your margin is above 50%. A store with a 60% margin makes money at 2× (break-even 1.67×); a store with a 40% margin loses money at 2× (break-even 2.5×). For a whole ad budget, 2× is a common result - the median Meta ecommerce ROAS in 2026 is 1.88×.
For most Shopify stores, yes. 3× clears break-even for any margin above 33% and beats the 2026 medians for Meta (1.88×) and Google Ads (2.87×). At a 30% margin, 3× still loses a little money.
4× is a good ROAS for almost every store, but it is not the line between profit and loss. It is the break-even ROAS of a store with a 25% margin. A store with a 50% margin keeps half of every extra sale at 4×; a store with a 20% margin still loses money.
Break-even ROAS is the ROAS at which the profit from your ad sales exactly pays for the ads. It is 1 ÷ your profit margin before ads. A $60 order that costs $30 to make, ship and process has a 50% margin, so it breaks even at 2×.
ROAS divides sales by ad spend. ROI divides the profit the ads made, after the ad spend, by the ad spend. $2,900 in sales from $1,000 of ads is a ROAS of 2.9×; at a 40% margin it leaves $160 profit, an ROI of 16%.
Above your break-even ROAS, measured against your Shopify orders. As a benchmark, Triple Whale puts the median ecommerce ROAS on Meta at 1.88× in 2026. Ads to new customers usually show less, retargeting more.
They count different sales. Meta counts orders within its click and view windows, also when the last visit came from elsewhere; Shopify's last-click report credits each order to the last visit only. In a sample of 28 Shopify stores, 1 in 10 orders with a Facebook or Instagram visit was finished on a visit from somewhere else.